



























































Main Facts
New York City’s public safety landscape in 2026 presents a complex dichotomy. On a macro level, citywide statistics indicate a safer metropolis, with major felony categories experiencing significant declines. However, an analysis of precinct-level data reveals that these improvements are far from uniform. The downward trajectory of urban crime is stalling in specific pockets of the Bronx and Brooklyn, where violent crime—particularly felony assault—remains stubbornly high.
According to preliminary NYPD CompStat data covering January 1 through July 26, 2026, the city recorded 63,710 complaints across the seven major felony categories. This represents a 6.5% decrease compared to the 68,151 incidents reported during the same period in 2025. This overall contraction was driven by notable drops in highly visible crimes:
- Murders fell by 20.9% (from 187 to 148).
- Robberies decreased by 12% (from 8,473 to 7,453).
- Burglaries dropped by 14.9% (from 7,265 to 6,184).
- Grand larceny auto (vehicle theft) declined by 12.3% (from 7,652 to 6,709).
2026 NYC Crime Trend Summary (Through July 26)
📊 Overall Major Felonies: ▼ 6.5%
❤️ Murders:                ▼ 20.9%
💸 Robberies:              ▼ 12.0%
🏠 Burglaries:             ▼ 14.9%
🚗 Vehicle Thefts:         ▼ 12.3%
👊 Felony Assaults:        ▲ 0.0% (Flat)
⚠️ Reported Rapes:         ▲ 3.9%
Despite these positive indicators, felony assault remains a significant outlier. With 17,032 cases reported in the first part of 2026 compared to 17,029 in 2025, violent physical altercations remain unchanged.
Furthermore, reported rapes rose by 3.9%, misdemeanor assaults increased by 1.9%, and hate crimes grew by nearly 5%. This divergence highlights a critical reality: while property crimes and homicides are receding citywide, street-level violence and personal disputes continue to pressure specific neighborhoods, particularly in the South Bronx and eastern Brooklyn.
Chronology: The Evolution of NYC’s Crime Trajectory
To understand New York City’s current safety profile, one must examine the transition from the pandemic-era crime spikes of the early 2020s to the stabilized patterns of 2026.
[1980s-1990s] Peak crime eras; neighborhoods like Hunts Point & Brownsville establish persistent negative reputations.
      │
[2010s] Record-low crime rates citywide; gentrification begins shifting demographics in western Brooklyn.
      │
[2020-2022] Post-pandemic disruptions trigger nationwide spikes in homicides, shootings, and vehicle thefts.
      │
[2025] Stabilization phase; NYPD increases transit presence and targeted deployments to commercial corridors.
      │
[2026 (Jan-Jul)] Citywide major felonies drop 6.5%, but localized exceptions emerge (e.g., Bushwick spikes 25%).
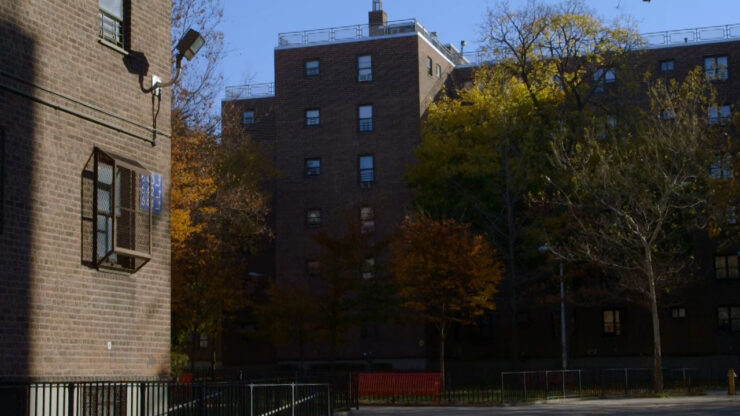
For decades, neighborhoods such as Brownsville, East New York, and Hunts Point carried reputations forged during the high-crime eras of the late 20th century. While the citywide crime drop of the 2010s altered the character of many districts, systemic issues like concentrated poverty, public housing disinvestment, and localized gang activity left certain precincts vulnerable to sudden fluctuations.
The disruptive economic and social conditions of the early 2020s triggered a nationwide surge in violent crime and auto thefts. By 2025, targeted law enforcement initiatives and community-led violence intervention programs began stabilizing these spikes.
The first half of 2026 represents a continuation of this post-pandemic stabilization, characterized by a return to historical downward trends in homicides and robberies.
However, this recovery is highly localized. For example, while the industrial peninsula of Hunts Point has experienced a 26% drop in major felonies compared to 2025, the nightlife hub of Bushwick has seen a sudden 25% surge in major felonies over the same period. This indicates that local commercial developments and changing land uses are actively reshaping crime dynamics in real time.
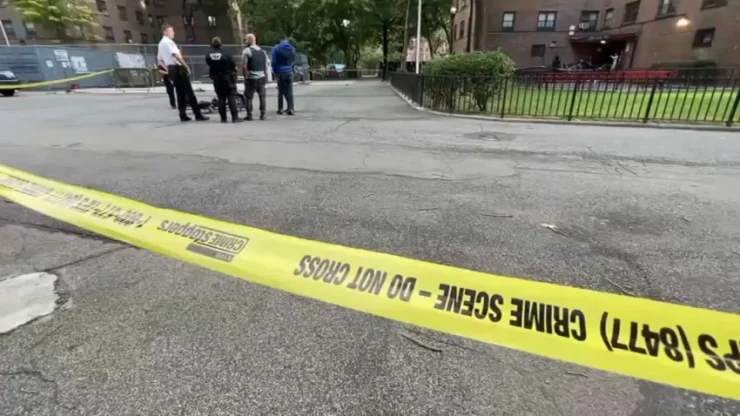
Supporting Data: Statistical and Geographic Breakdown
The disconnect between citywide averages and neighborhood realities is best understood by analyzing precinct-level data. The NYPD does not publish an official "dangerous neighborhood" ranking, as precinct boundaries do not align perfectly with neighborhood borders.
To provide a clearer picture, the following analysis examines the raw figures, percentage changes, and specific safety challenges across the city’s key areas.
Citywide Crime Statistics Comparison
The table below illustrates the shifting patterns of the seven major felonies in New York City, comparing the first seven months of 2026 against the corresponding period in 2025.
| Crime Category | 2026 (Through July 26) | Same Period in 2025 | YoY Change (%) |
|---|---|---|---|
| Murder | 148 | 187 | Down 20.9% |
| Rape | 1,226 | 1,180 | Up 3.9% |
| Robbery | 7,453 | 8,473 | Down 12.0% |
| Felony Assault | 17,032 | 17,029 | Unchanged (0.0%) |
| Burglary | 6,184 | 7,265 | Down 14.9% |
| Grand Larceny | 24,958 | 26,365 | Down 5.3% |
| Vehicle Theft | 6,709 | 7,652 | Down 12.3% |
| All Seven Major Felonies | 63,710 | 68,151 | Down 6.5% |
Neighborhood Risk Analysis: Top 10 Areas of Concern
By evaluating precinct-level data, crime density, and environmental factors, we can identify ten neighborhoods where elevated caution is warranted.
       [Top 10 Neighborhoods by Crime Concern in 2026]

   1. Mott Haven (Bronx)          ⚠️ Focus: Felony Assault & Robbery
   2. East New York (Brooklyn)    ⚠️ Focus: Assault, Shootings, Auto Theft
   3. Fordham (Bronx)             ⚠️ Focus: Rising Assaults & Robberies
   4. Highbridge (Bronx)          ⚠️ Focus: Assault, Robbery, Gun Violence
   5. Tremont (Bronx)             ⚠️ Focus: Assault & Shooting Incidents
   6. Bushwick (Brooklyn)         ⚠️ Focus: Sharp 25% Surge in Major Felonies
   7. Brownsville (Brooklyn)      ⚠️ Focus: Felony Assault & Gun Violence
   8. Bed-Stuy (Brooklyn)         ⚠️ Focus: Assault, Robbery & Grand Larceny
   9. East Harlem (Manhattan)     ⚠️ Focus: Transit Theft & Street Assault
  10. Hunts Point (Bronx)         ⚠️ Focus: Industrial Block Isolation
Detailed breakdowns of these ten areas reveal distinct local dynamics:
1. Mott Haven (Bronx – 40th Precinct)
- Statistical Reality: Recorded 1,808 major felonies through July 26, 2026. While this is an 8% decrease from 2025, it remains the highest raw total among primarily residential precincts.
- The Divergence: Robbery (-14.5%), burglary (-17%), and vehicle theft (-25%) dropped significantly. However, felony assaults rose from 585 to 629 cases. The precinct also reported 17 shooting incidents and 19 victims.
- Context: Rapid waterfront gentrification has introduced luxury high-rises and new dining options. However, these changes are concentrated, leaving adjacent residential streets and industrial corridors with uneven foot traffic and lighting.
2. East New York (Brooklyn – 75th Precinct)
- Statistical Reality: Recorded 1,686 major felonies, representing a 9% decline from 2025.
- The Divergence: Robbery (-17%), burglary (-27%), and grand larceny (-14%) fell. Conversely, felony assaults rose from 587 to 611, murders increased from seven to nine, and shooting incidents remained flat at 26.
- Context: Risk varies widely across this expansive neighborhood. Transit hubs like Broadway Junction feature heavy commuter traffic and a visible police presence, but adjacent residential and industrial blocks can quiet down quickly after dark.
3. Fordham (Bronx – 46th Precinct)
- Statistical Reality: Major felonies rose by 8.3% through late July, bucking the citywide downward trend.
- The Divergence: Felony assaults surged by 23% (from 512 to 629), robberies rose by 9%, burglaries by 13%, and murders increased from four to nine. Grand larceny auto was a bright spot, falling by one-third.
- Context: As one of the borough’s busiest commercial and transit corridors, Fordham Road attracts heavy pedestrian crowds. This density contributes to pickpocketing and retail theft during the day, which transitions to street-level disputes after business hours.
4. Highbridge (Bronx – 44th Precinct)
- Statistical Reality: Recorded 1,532 major felonies, down 10.3% from the previous year.
- The Divergence: While robberies and vehicle thefts declined, felony assault remained the largest single category with 567 complaints. Shooting incidents rose from 13 to 15.
- Context: The presence of Yankee Stadium creates distinct safety dynamics. Game days bring heavy crowds, increasing opportunities for pickpocketing and phone snatching. Conversely, non-game days leave the area’s steep step-streets and parks isolated.
5. Tremont (Bronx – 48th Precinct)
- Statistical Reality: Total major felonies fell by 12.5% to 1,249 incidents.
- The Divergence: Homicides dropped from 11 to three, and robberies declined by 35%. However, shooting incidents rose from 16 to 17, and felony assaults remained high at 396 cases.
- Context: Commercial strips along East Tremont Avenue maintain active foot traffic. However, quiet residential side streets require higher situational awareness, particularly late at night.
6. Bushwick (Brooklyn – 83rd Precinct)
- Statistical Reality: Major felonies surged by 25%, rising from 875 to 1,094 incidents.
- The Divergence: Robbery rose by 37%, felony assault by 42%, burglary by 41%, and grand larceny by 24%. Shootings and vehicle thefts were the only categories to decline.
- Context: Unlike other neighborhoods on this list, Bushwick’s crime increase is closely tied to its active nightlife. The concentration of bars, music venues, and late-night warehouse events has led to an increase in alcohol-related altercations and opportunistic thefts targeting patrons leaving venues.
Bushwick (83rd Precinct) Crime Surges in 2026:
📈 Felony Assault:  ▲ 42%
📈 Burglary:        ▲ 41%
📈 Robbery:         ▲ 37%
📈 Grand Larceny:   ▲ 24%
7. Brownsville (Brooklyn – 73rd Precinct)
- Statistical Reality: Major felonies fell by 14.3% to 966 incidents.
- The Divergence: Robberies (-21%), felony assaults (-10%), and grand larcenies (-16%) all trended downward. Shootings dropped from 19 to 12, and shooting victims decreased from 23 to 15.
- Context: Despite these positive trends, violent crime density remains high, with 429 felony assaults recorded. These incidents are often concentrated around specific public housing developments and are frequently linked to localized disputes rather than random street crime.
8. Bedford-Stuyvesant (Brooklyn – 79th Precinct)
- Statistical Reality: Major felonies decreased slightly, from 779 to 745.
- The Divergence: Felony assaults fell from 269 to 232, robberies declined from 117 to 107, and shootings dropped from 11 to seven. Grand larceny rose from 229 to 244.
- Context: Bed-Stuy’s large geographic footprint features block-by-block variations. Historic brownstone blocks and commercial corridors like Fulton Street are active and well-lit, but industrial borders and quieter residential blocks require more attention after dark.
9. East Harlem (Manhattan – 23rd Precinct)
- Statistical Reality: Major felonies fell by 16.3%, dropping from 778 to 651.
- The Divergence: The precinct recorded zero murders (down from two in 2025). Robberies fell by 26%, burglaries by 34%, and felony assaults by 10%. However, petty larceny rose by nearly 15%.
- Context: The increase in petty theft is concentrated around transit hubs like the 125th Street and Lexington Avenue subway station. While violent crime has decreased, commuter-focused property theft remains a practical concern.
10. Hunts Point (Bronx – 41st Precinct)
- Statistical Reality: Major felonies fell by 26.4%, dropping from 877 to 645.
- The Divergence: Robberies fell from 152 to 105, felony assaults dropped from 250 to 186, and vehicle thefts were cut by more than half.
- Context: Hunts Point is home to the city’s primary food distribution hubs, drawing heavy commercial truck traffic during the day. However, its industrial layout means that warehouse blocks become isolated after business hours, presenting a different environment than typical residential areas.
The Midtown Exception: Understanding Volume vs. Risk
Midtown Manhattan frequently ranks near the top of raw crime lists, a placement that requires important context. The Midtown South Precinct—which covers Times Square, Penn Station, Grand Central, and major retail corridors—recorded 1,611 major felonies through July 26, 2026 (a 10.5% decrease from 2025).

Midtown South Precinct Crime Profile:
- Grand Larceny: 61.6% of all major felonies (993 cases)
- Violent Crime: Exceptionally low relative to pedestrian volume
- Shooting Incidents: Only 2 reported through July 26, 2026
This data shows that Midtown’s primary safety challenge is property crime rather than physical violence. With millions of tourists, commuters, and shoppers passing through daily, the area presents a target-rich environment for pickpocketing, retail theft, and crimes of opportunity.
Official Responses and Intervention Strategies
The divergent crime trends of 2026 have prompted varied strategies from city officials, law enforcement, and community leaders.
                         [NYPD CompStat Analysis]
                                    │
         ┌──────────────────────────┴──────────────────────────┐
         ▼                                                     ▼
[Precision Policing & Saturation]                    [Community-Led Initiatives]
- Transit safety sweeps                              - Cure Violence deployment
- Nightlife safety details (Bushwick)                - Credible messengers in schools
- Floodlights in commercial corridors                - Housing development youth programs
NYPD Tactical Adjustments
Faced with rising felony assaults in specific precincts, the NYPD has shifted toward "precision policing." This approach utilizes real-time CompStat data to deploy tactical units to micro-locations—sometimes down to specific street corners or housing blocks—rather than saturating entire neighborhoods.
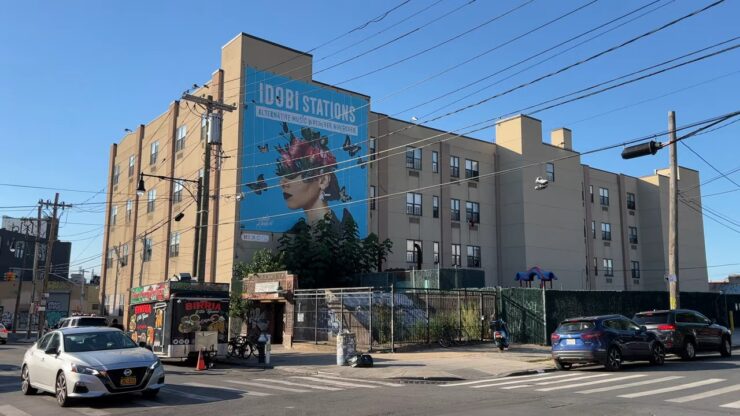
- Nightlife Safety Details: In response to the 25% surge in Bushwick’s 83rd Precinct, the NYPD established dedicated weekend details along the Wyckoff Avenue and Flushing Avenue corridors. These details focus on crowd control, monitoring unlicensed venues, and increasing police visibility during peak nightlife exit hours (2:00 AM to 5:00 AM).
- Transit and Retail Initiatives: In areas like East Harlem and Fordham, the NYPD has increased officer deployments at subway turnstiles and busy bus transfer points to address the rise in petty thefts and misdemeanor assaults.
Community-Based Violence Interventions
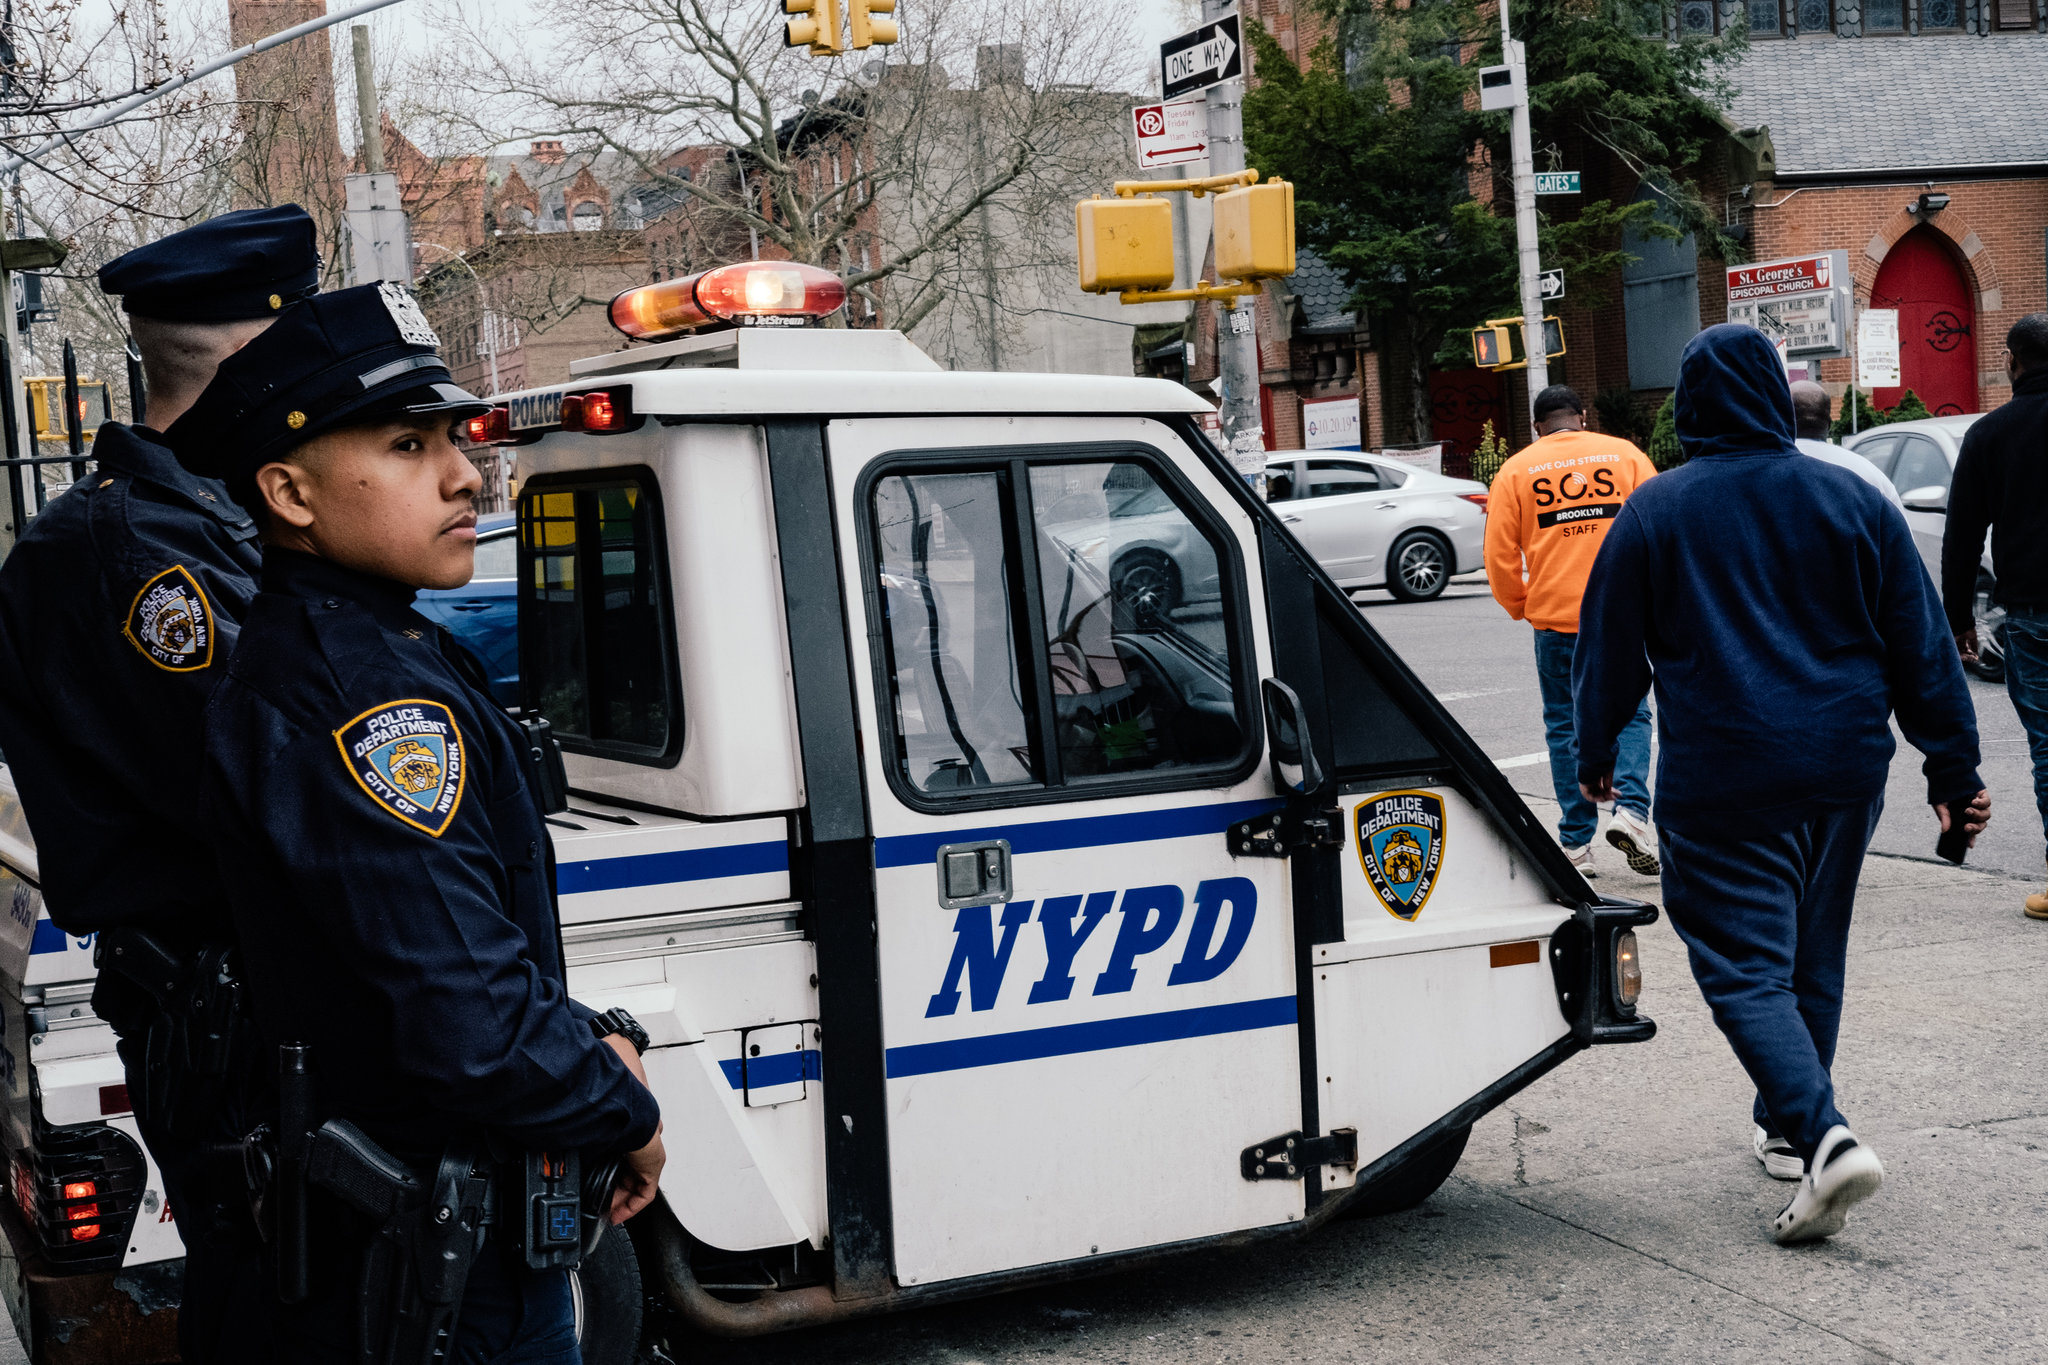
Local leaders and criminologists emphasize that policing is only one part of the solution. In neighborhoods like Brownsville and Mott Haven, community-led violence interruption programs (such as Cure Violence and Save Our Streets) have played a key role in reducing shooting incidents.
These initiatives employ "credible messengers"—often neighborhood residents who have been personally affected by the justice system—to mediate interpersonal disputes before they escalate into physical violence.
Advocates point out that while these programs have successfully reduced gun violence, sustaining funding and expanding resources to address non-gun-related felony assaults remains an ongoing challenge.
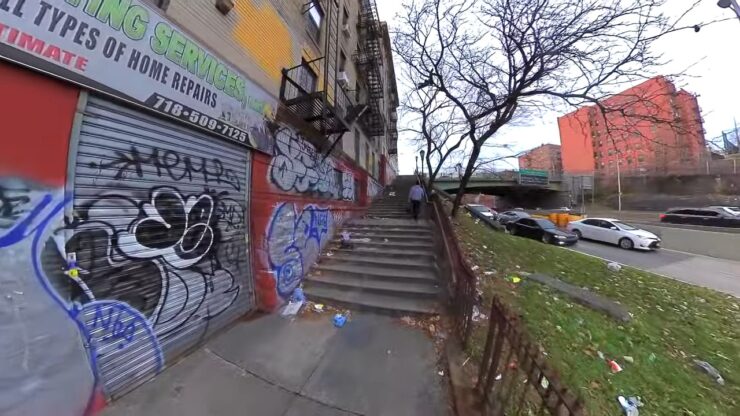
Implications for Residents, Visitors, and Urban Planning
The uneven distribution of crime in 2026 carries broader implications for daily life, real estate development, and municipal policy in New York City.
       ECONOMIC IMPACTS                   URBAN PLANNING                   PUBLIC PERCEPTION
┌──────────────────────────────┐ ┌──────────────────────────────┐ ┌──────────────────────────────┐
│ Gentrification friction in   │ │ Need for better lighting and │ │ Media focus on raw totals    │
│ Mott Haven; commercial growth│ │ pedestrian infrastructure on │ │ obscures local improvements  │
│ vs. persistent local crime.  │ │ transit-adjacent corridors.  │ │ in historic hot spots.       │
└──────────────────────────────┘ └──────────────────────────────┘ └──────────────────────────────┘
The Real Estate and Gentrification Friction
In neighborhoods like Mott Haven, the contrast between new luxury residential developments and persistent localized crime highlights the complexities of rapid urban redevelopment.
While new waterfront construction has altered the area’s aesthetic, it has not automatically translated into improved safety or infrastructure for the broader community. Criminologists note that true neighborhood safety requires holistic investments, including street lighting, active commercial spaces, and community resources, rather than isolated residential developments.
Navigating the Urban Environment
For residents and visitors, the 2026 data underscores that safety in New York City is highly situational, depending more on the specific street, hour, and activity than on broad neighborhood labels.
- In Residential and Industrial Areas: The primary safety strategy remains situational awareness: sticking to well-lit, active routes, planning transit connections in advance, and avoiding isolated shortcuts after dark.
- In Commercial and Transit Hubs: The main focus shifts to securing personal belongings, keeping electronics out of sight near subway doors, and staying aware of surroundings in dense crowds.
Ultimately, New York City’s 2026 crime data shows a city that is safer on several key fronts, but one where the benefits of these improvements are not felt equally by all communities. Addressing these persistent localized challenges will require continued coordination between law enforcement, local community organizations, and urban planners.